Use
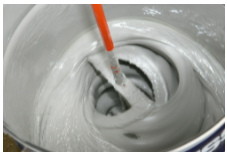
Various materials such as epoxies or other composite resins, slow curing adhesives, gelatins or hydrocarbon gels.
Test Equipment
Instrument: Viscometer or Rheometer
Spindle: Choice of either standard spindles, or preferably, disposable spindles and chambers for easy cleanup.
Accessories: Various choices: Small Sample Adapter, TC-550AP Programmable Bath, Thermosel™ with Programmable Controller
Speed: Various possibilities: 100 to 0.01 RPM
Test Method
The Cure Mode algorithm was developed in response to customer concern that their gel timers did not provide viscosity or rheological data. They could not afford expensive rheometers that would monitor gelation or “curing” of materials such as epoxies. This algorithm allows data to be taken over very large viscosity ranges - several decades, in fact. Brookfield Rheocalc™ software is used for instrument control and data acquisition. The software “wizard” in Rheocalc is used - “Cure Mode” is selected, and the wizard guides the user in setting up a test.
In the following example, Brookfield DV3TLV was used with SC4-27RD disposable spindles and SC4-13RD disposable sample chambers. The initial speed was 100 rpm. The viscosity increased as the epoxy system reacted or cured. Each time the measured torque reached 90% of Full Scale Range or “FSR”, the speed was decreased by a factor of 10. The program ended the run when 90% of FSR was reached at the slowest speed - in this case, 0.01 RPM. Figure 1 shows the data.
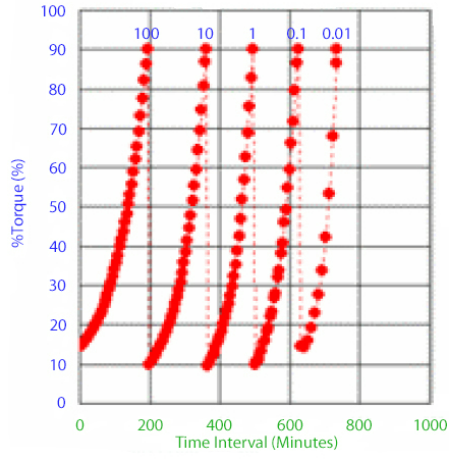
Figure 1: Epoxy Cure at 23°C. % Torque vs. Time
Each curve represents data for a different rotational speed (RPM)
Each curve in Figure 2 represents rotational speeds for the spindle. The left-most curve is the torque data at 100 rpm; the right-most curve is 0.01 RPM. Spindle speed decreases by an order of magnitude with each successive time interval.
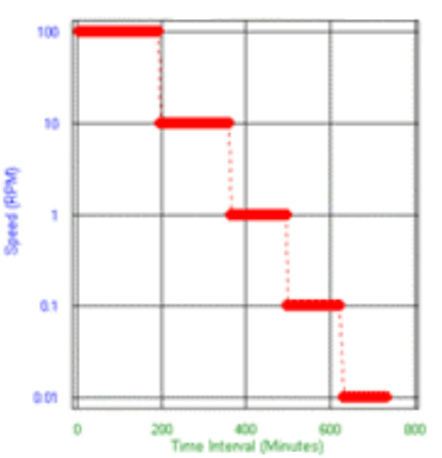
Figure 2: Spindle Speed vs. Time Data for the Epoxy Cure Test
The reaction or “cure” proceeds faster as the test temperature is increased. Figure 3 shows viscosity changing vs. time for three different control temperatures: 23°C, 50°C and 60°C.
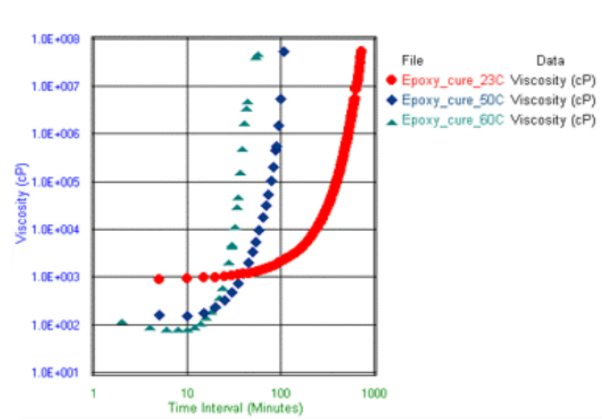
Figure 3: Viscosity vs. Time Data for epoxy cure test at three different temperatures.
Epoxy cure monitored at 23°, 40° and 60°C
<<Download a pdf of this application note.
Contact us : This email address is being protected from spambots. You need JavaScript enabled to view it.